

Getting to Know Our Parish
/
Last week in this column, I shared the focus of the 2018 North Texas Annual Conference: “New Faces, New Spaces.”
The conference sparked my own interest in thinking about what it would mean for Kessler Park UMC to intentionally reach out to the new faces around us, and I posed the following questions: “Can we make space for the new faces? Do we need to create new spaces? What do we have to offer the people of Oak Cliff?”
Before we answer these questions, however, it is wise to ask a more basic question: Who are the people who live around us? What do they look like? What do they do? What kind of families are they in? How old are they?
Fortunately, the North Texas Conference makes available (for local churches) free access to the demographic findings of MissionInsite, a group which does extensive analysis of neighborhoods for churches and non-profit organizations. With just a few clicks, I was able to pull incredibly detailed information about the people in our part of town.
Over the next couple of weeks, I want to share some of the findings revealed by MisisonInsite. Before I do, I want to emphasize two things: first, demographic studies are no replacement for the work of spiritual discernment. Looking at numbers on pages does not excuse us from doing the hard work of getting to know real people in our neighborhoods and listening to their concerns. Demographics are nothing but indicators that might guide or point us in the right direction, but they cannot replace relationships and prayer.
Second, demographic projections are simply that — projections. They are not fact. They cannot be relied upon to give us 100% accurate pictures of the future. There are an unknown number of variables that go into the reality of neighborhood development and growth. Just because a report predicts that a particular type of people are going to move into a particular neighborhood in the next five years doesn’t make it so.
Again, I must stress that the usefulness of such numbers is simply limited to helping us orient ourselves to our own context and mission field. I always look for the things that surprise me, rather than the things that confirm my common sense observations. This is where demographic studies can be so helpful and enlightening.
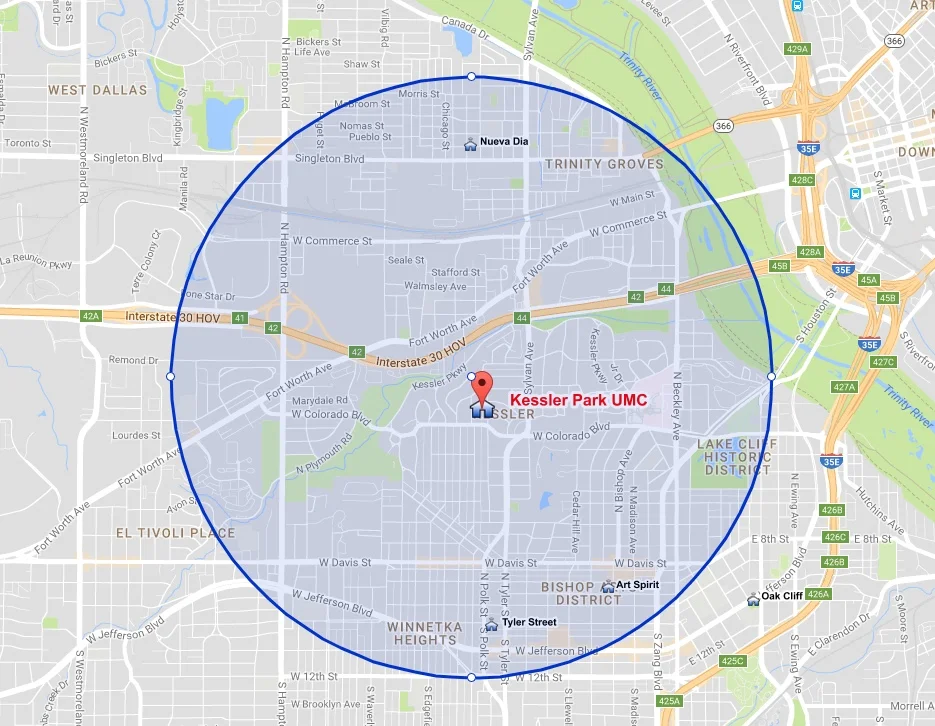
This week, I would like to share some of the things that grabbed my attention upon reviewing basic demographic information about the people who live around Kessler Park UMC. My search area was restricted to a 1.5 mile radius around the church; this extends to Trinity Groves in the north, 12th Street on the south, a few blocks west of Hampton in the west, and just shy of I-35 on the east side.
One of the first things that struck me was the fact that there are at least three very distinct people groups in this radius: we are surrounded by mostly Hispanic neighbors (67% of the population, which is predicted to remain steady over the next five years), but our immediate neighbors are wealthier whites who are either at, or near, retirement. Furthermore, there is a ring of young singles moving into those apartments; they are mostly in their twenties, and they are a highly diverse racial group.
Overall, the population in this area is not projected to grow dramatically: in 2000, 38,600 lived within 1.5 miles of the church. By 2010, this number had dropped to 31,223, and is slowly moving upward since. Currently, 34,214 live here, a number which is only expected to grow 4.8% in the next five years.
Unsurprisingly, the two age groups which are expected to gain the most percentage-wise over the next ten years, are ages 18-24 and people 65 and older.
I realized that the exact location of KPUMC shields us from recognizing the great diversity in our immediate area. We are located in a beautiful, upscale neighborhood with rolling hills and carefully-groomed trees, and homes that are easily worth over half a million dollars. Yet compared to the entire state of Texas, the number of families living in poverty in the search area is significantly higher than the state average!
The estimated current average household income is $74,275, and this is expected to grow almost 14% over the next five years, but the growth appears to extend mostly to white families. In 2017, the median income of white families is $89,285; but for Hispanic families, the median income is $39,267, and only $29,347 for blacks.
Furthermore, the overall educational attainment of adults in this community is lower than the state average.
Remember these numbers apply to the people who live within a 1.5 mile radius of the church! This is what our parish looks like. This is the reality of the people whom we have been called to serve, give hope, and inspire.
This is a hard and complex question, but it doesn’t hurt to wrestle with it anyway: why doesn’t our congregation look more like the people in our area? Do we have all three distinct people groups represented in our church? Why not?
I also learned that the level of religiosity is “somewhat low” compared to the state average. But that’s a subject for next week’s column …